Boost User Engagement with the Best WordPress Heatmap Plugins
Understanding Heatmaps and Their Importance
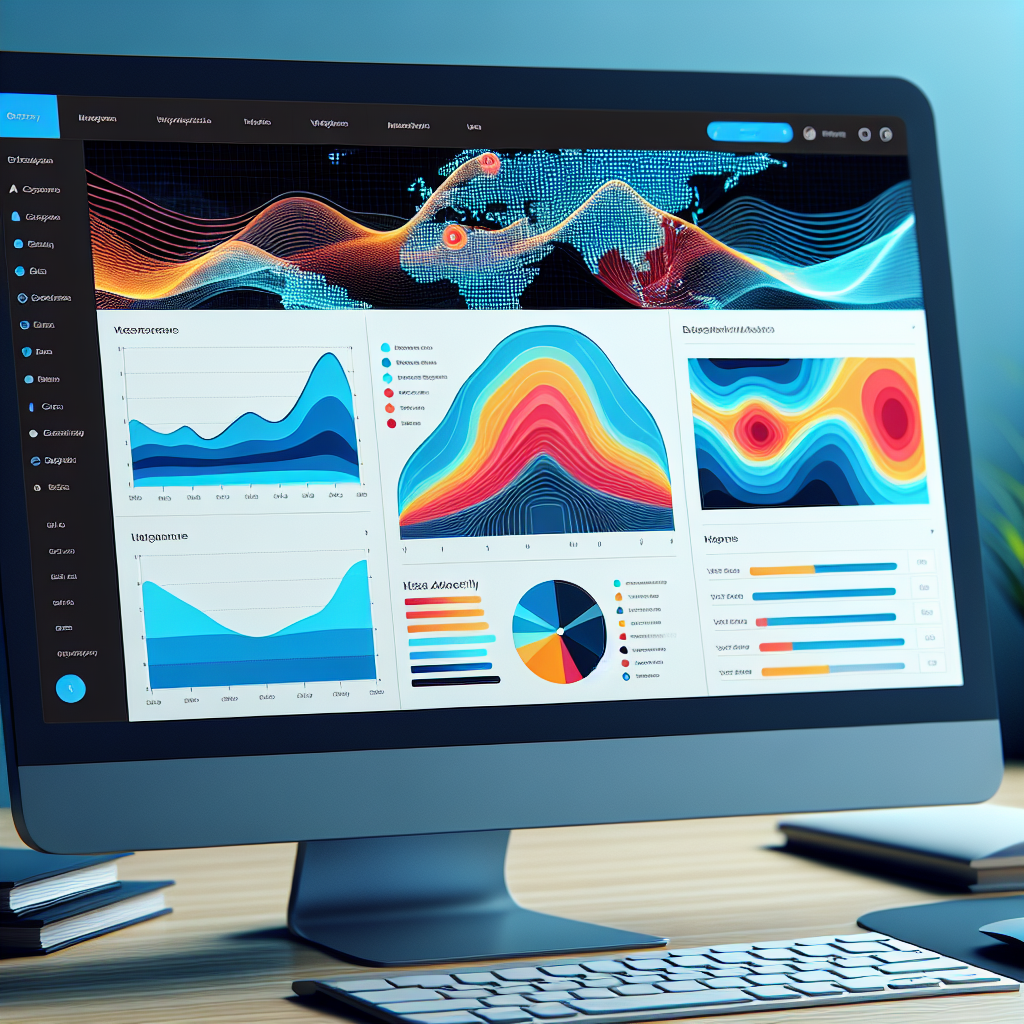
Heatmaps are a powerful tool that provide visual insights into how users interact with a webpage. They allow website owners to quickly interpret information about user engagement, such as which sections are getting the most attention through cool and warm colors.
For WordPress sites, utilizing heatmaps can improve user experience by identifying which elements are most engaging. This understanding helps in making informed decisions about site design and content.
Tracking user behavior with a heatmap plugin equips site managers with invaluable data for precise optimization, enhancing site performance and user satisfaction.
Benefits of Using Heatmaps:
- Identifies engaging site elements
- Optimizes call-to-action elements
- Enhances promotional strategies
Choosing the Right Heatmap Plugin for WordPress
Ease of Use and Setup
Look for a plugin that is easy to install and configure, with a user-friendly interface that doesn’t require technical expertise.
Detailed Reporting
Ensure it offers comprehensive reporting with click maps, scroll maps, and session recordings to understand user interactions.
Integration Capabilities
The plugin should integrate well with analytics tools and marketing platforms for seamless data exchange.
Performance Impact
Opt for a lightweight plugin to minimize the impact on site speed, enhancing user experience and SEO.
Support and Updates
Choose a plugin with regular updates and active support to ensure compatibility and new features.
Price
Evaluate pricing models, balancing the value of features with your budget to make the best choice.
Top Free Heatmap Plugins for WordPress
Crazy Egg
Offers a free trial with access to heatmaps, scrollmaps, and the ‘confetti’ feature for segmented click data. Ideal for gaining initial insights into user behavior.
Learn MoreInspectlet
Provides real-time analytics and session recording on a free plan, making it perfect for startups to see what users click and scroll through.
Learn MoreMouseflow
Tracks clicks, movements, scrolls, and forms. Allows session replays to help understand complex user behaviors.
Learn MoreWP Heatmap
Specifically for WordPress, offering basic heatmap features ideal for beginners.
Learn MoreHeatmap for WordPress
Real-time reporting without external servers, supporting multiple views across devices to enhance user engagement.
Learn MorePrivacy-Focused Heatmap Plugin Options
Respect user privacy while obtaining valuable insights with these plugins.
Koko Analytics
Koko Analytics processes all data locally, ensuring that user data remains private. It provides real-time insights, presenting data in an easy-to-interpret manner.
Matomo
Matomo offers powerful analytics capabilities with an emphasis on privacy. It hosts data locally, complying with GDPR and other privacy regulations.
Fathom Analytics
Fathom provides privacy-first analytics compliant with GDPR, offering insights into visitor trends without compromising personal data.
Plausible Analytics
Plausible is open-source and privacy-friendly, providing a broader picture of user engagement while complying with privacy laws like GDPR.
How to Install and Configure Heatmap Plugins
Installing a heatmap plugin on your WordPress site is a straightforward process that can provide valuable insights into user behavior. Follow this guide to set up and configure effectively.
-
Installation
Log into your WordPress admin dashboard. Navigate to ‘Plugins’ and click ‘Add New.’ Search for your chosen plugin like ‘Crazy Egg’ and click ‘Install Now’. Activate the plugin once installed.
-
Configuration
Create an account with your selected plugin and procure a unique tracking code.
-
Adding the Tracking Code
Enter the tracking code on the plugin’s settings page in WordPress. Some plugins allow direct authentication via WordPress.
-
Setting Up Tracking
Select pages like home, landing, or major posts to track interaction.
-
Testing
Verify the setup by visiting tracked pages logged out of WordPress, using incognito mode or different browser.

Case Studies: Success Stories with Heatmap Plugins
E-commerce Website
An e-commerce platform successfully used heatmap plugins to visualize user interactions. By tracking user focus on different page elements, they reorganized their site layout, resulting in a 25% increase in overall conversions.
Content Marketing Agency
A content agency optimized landing pages using heatmaps that identified non-clickable images attracting user attention. By making these images clickable, they increased user engagement by nearly 30%.
Best Practices for Using Heatmaps Effectively
Clarify Objectives
Understand the specific user behaviors you want to analyze. This focus helps in making informed decisions for enhancing user experience. Utilizing tools like a WordPress plugin can simplify data visualization.
Identify Patterns
Look for unexpected patterns such as clicks on non-interactive elements. These findings can guide layout adjustments to enhance CTA visibility and improve conversion rates.
Segment Data
Analyze behavior differences across user demographics or devices. Utilizing a comprehensive suite of plugins can facilitate a tailored analysis.
Complement with Other Analytics
Heatmap data should be complemented with other tools like user feedback and A/B testing to ensure comprehensive insights and data-driven optimizations.
Exploring Alternatives to Heatmap Plugins
Session Recording
Session recording tools like Crazy Egg and Mouseflow capture individual user interactions in real-time, mapping every click, scroll, and page transition. This offers a detailed view of user journeys and potential friction points.
Watch user playback sessionsUser Feedback Tools
Leveraging user polls and surveys can provide answers to the “why” behind user actions. Services like SurveyMonkey or Qualaroo offer a seamless way to gather user sentiment and feedback directly on WordPress sites.
Gather user insightsBehavioral Analytics
Google Analytics not only tracks user traffic but also provides powerful insights into behavior patterns through event tracking and goal conversions, helping you understand site performance over time.
Track user behavior patternsA/B Testing Tools
A/B testing tools allow you to test different webpage versions to see which performs better, offering a data-driven approach to optimize site performance based on user preferences.
Test and optimize pagesBrowse Categories:
You may also like

Enhance User Experience by Tracking Visitor Behavior on Your WordPress Site
Discover how to enhance user experience with WordPress plugins that track and analyze visitor behavior responsibly and effectively.

Boost Conversions with WordPress Heatmap and Session Recording Plugins
Discover how to use WordPress heatmap plugins and session recordings to boost conversions by understanding user behavior like never before.

Unveiling User Behavior: Top Plugins for Heatmaps and Click Tracking on WordPress
Discover the best plugins to track user behavior and click on WordPress, enhancing site experience and unlocking actionable insights.